Thus, as shown in Figure 1, the motion
of a mechanical system can be completely described as a function of
time, frequency, or the Laplace variable, s. Most importantly, all
are valid ways of characterizing a system and the choice is
generally dictated by the type of information that is desired.
Because the behavior of mechanical structures is more easily
characterized in the frequency domain, especially in terms of modes
of vibration we will devote our attention to their frequency domain
descriptions.
A mode of vibration (the kth mode) is completely
described by the four Laplace parameters: wk, the natural
frequency;  , the modal damping
coefficient; and the complex residue which is expressed as two
terms, magnitude and phase. The residues define the mode shapes for
the system. The Fourier transfom is the tool that allows us to
transform time domain signals to the frequncy domain and thus
observe the Laplace domain along the frequency axis. It is possible
to show that the transfer function over the entire splane is
completely determined by its values along the jw axis, so the
frequency response function contains all of the necessary
information to identify modal parameters.
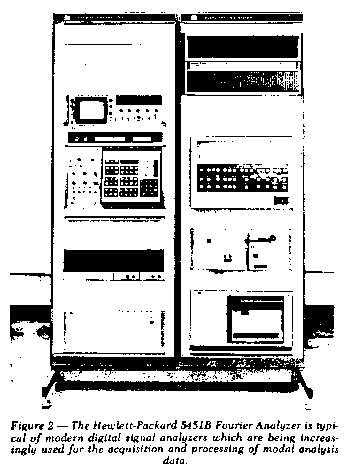
Digital Fourier analyzers, such as the one shown in Figure 2,
have proven to be ideal tools for measuring structural frequency
response functions (transfer functions) quickly and accurately.
Coupling this with the fact that modes of vibration can be
identified from measured frequency response functions by digital
parameter identification techniques gives the testing laboratory an
accurate and costeffective means for quickly characterizing a
structure's dynamic behavior by identifying its modes of
vibration.2
The remainder of this article will attempt to introduce some of
the techniques which are available for making effective frequency
response measurements with digital Fourier analyzers.
Measuring Structural Frequency Response Functions
The general scheme for measuring frequency response functions
with a Fourier analyzer consists of measuring simultaneously an
input and response signal in the time domain, Fourier transforming
the signals, and then forming the system transfer function by
dividing the transformed response by the transformed input. This
digital process enjoys many benefits over traditional analog
techniques in terms of speed, accuracy and postprocessing
capability.3 One of the most important features of
Fourier analyzers is their ability to form accurate transfer
functions with a variety of excitation methods. This is in contrast
to traditional analog techniques which utilize sinusoidal
excitation. Other types of excitation can provide faster
measurements
and a more accurate simulation of the type of excitation which
the structure may actually experience in service. The only
requirement on excitation functions with a digital Fourier analyzer
is that they contain energy at the frequencies to be measured.
The following sections will discuss three popular methods for
exciting a structure for the purpose of measuring transfer
functions; they are, random, transient, and sinusoidal excitation.
To begin with, we will restrict our discussion to baseband
measurements; i.e., measurements made from dc (zero frequency) to
some Fmax (maximum frequency). The procedures for using
these broadband stimuli (except transient) are all very similar.
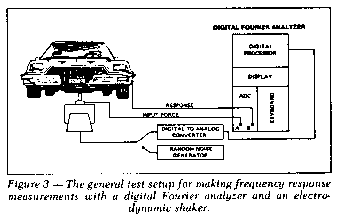
They are typically used to drive a shaker which, in turn, excites
the mechanical structure under test. The general process is
illustrated in Figure 3.
Random Excitation Techniques
In this section, three types of broadband random excitation which
can be used for making frequency response measurements are
discussed. Each one possesses a distinct set of characteristics
which should be understood in order to use them effectively. The
three types are: (1) pure random, (2) pseudo random, and (3)
periodic random.
Typically, pure random signals are generated by an external
signal generator, whereas pseudo random and periodic random are
generated by the analyzer's processor and output to the structure
via a digitaltoanalog converter, as shown in Figure 3.
Figure 4 illustrates each type of random signal.
Pure Random
Pure random excitation typically has a Gaussian distribution and
is characterized by the fact that it is in no way periodic, i.e.,
does not repeat. Typically, the output of an independent signal
generator may be passed through a bandpass filter in order to
concentrate energy in the band of interest. Generally, the signal
spectrum will be flat except for the filter rolloff and, hence,
only the overall level is easily controlled.
One disadvantage of this approach is that, although the shaker is
being driven with a flat input spectrum, the structure is being
excited by a force with a different spectrum due to the impedance
mismatch between the structure and shaker head. This means that the
force spectrum is not easily controlled and the structure may not be
forced in the optimum manner. Since it is difficult to shape the
spectrum because it is not generally controlled by the computer,
some form of closedloop force control system would ideally he
used. Fortunately, in most cases, the problem is not important
enough to warrant this effort.
A more serious drawback of pure random excitation is that the
measured input and response signals are not periodic in the
measurement time window of the analyzer. A key assumption of digital
Fourier analysis is that the time waveforms he exactly periodic in
the observation window. If this condition is not met, the
corresponding frequency spectrum will contain socalled
"leakage" due to the nature of the discrete Fourier transform; that
is, energy from the nonperiodic parts of the signal will leak"
into the periodic parts of the spectrum, thus giving a less accurate
result.
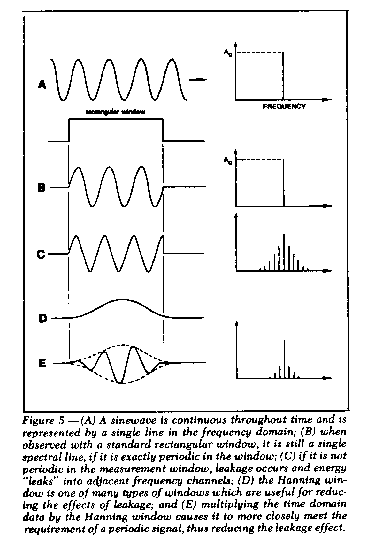
In digital signal analyzers, nonperiodic time domain data is
typically multiplied by a weighting function such as a Hanning
window to help reduce the leakage caused by nonperiodic data
and a standard rectangular window.

When a nonperiodic time waveform is multiplied by this
window, the values of the signal in the measurement window more
closely satisfy the requirements of a periodic signal. The result is
that leakage in the spectrum of a signal which has been multiplied
by a Hanning window is greatly reduced.
However, multiplication of two time waveforms, i.e., the
nonperiodic signal and the Hanning window, is equivalent to the
convolution of their respective Fourier transforms (recall that
multiplication in one domain is exactly equivalent to convolution in
the other domain). Hence, although multiplication of a
nonperiodic signal by a Hanning window reduces leakage, the
spectrum of the signal is still distorted due to the convolution
with the Fourier transform of the Hanning window. Figure 5
illustrates these points for a simple sinewave.
With a pure random signal, each sampled record of data T seconds
long is different from the preceeding and following records. (Figure
4). This gives rise to the single most important advantage of using
a pure random signal for transfer function measurement. Successive
records of frequency domain data can be ensemble averaged together
to remove nonlinear effects, noise, and distortion from the
measurement. As more and more averages are taken, all of these
components of a structure's motion will average toward an expected
value of zero in the frequency domain data. Thus, a much better
measure of the linear least squares estimate of the response of the
structure can be obtained.3
This is especially important because digital parameter estimation
schemes are all based on linear models and the premise that the
structure behaves in a linear manner. Measurements that contain
distortion will be more difficult to handle if the modal parameter
identification techniques used are based upon a linear model of the
structure's motion.
PseudoRandom
In order to avoid the leakage effects of a nonperiodic
signal, a waveform known as pseudo random is commonly used. This
type of excitation is easy to implement with a digital Fourier
analyzer and its digitaltoanalog (DAC) converter. The most
commonly used pseudo random signal is referred to as
"zerovariance random noise." It has uniform spectral density
and random phase. The signal is generated in the computer and
repeatedly output to the shaker through the DAC every T seconds
(Figure 4). The length of the pseudo random record is thus exactly
the same as the analyzer's measurement record length (T seconds),
and is thus exactly periodic in the measurement window.
Because the signal generation process is controlled by the
analyzer's computer, any signal which can be described digitally can
be output through the DAC. The desired output signal is generated by
specifying the amplitude spectrum in the frequency domain; the phase
spectrum is normally random. The spectrum is then
Fourier transformed to the time domain and output through the
DAC. Therefore, it is relatively easy to alter the stimulus spectrum
to account for the exciter system characteristics.
In general, besides providing leakagefree measurements, a
technique using pseudo random noise can often provide the fastest
means for making a statistically accurate transfer function
measurement when using a random stimulus. This proves to be the case
when the measurement is relatively free of extraneous noise and the
system behaves linearly, because the same signal is output
repeatedly and large numbers of averages offer no significant
advantages other than the reduction of extraneous noise.
The most serious disadvantage of this type of signal is that
because it always repeats with every measurement record taken,
nonlinearities, distortion, and periodicities due to rattling
or loose components on the structure cannot be removed from the
measurement by ensemble averaging, since they are excited equally
every time the pseudo random record is output.
Periodic Random
Periodic random waveforms combine the best features of pure
random and pseudo random, but without the disadvantages; that is, it
satisfies the conditions for a periodic signal, yet changes with
time so that it excites the structure in a truly random manner.
The process begins by outputting a pseudo random signal from the
DAC to the exciter. After the transient part of the excitation has
died out and the structure is vibrating in its steadystate
condition, a measurement is taken; i.e., input, output, and cross
power spectrums are formed. Then, instead of continuing to output
the same signal again, a different uncorrelated pseudo random
signal is synthesized and output (refer again to Figure 4). This new
signal excites the structure in a new steadystate manner and
another measurement is made.
When the power spectrums of these and many other records are
averaged together, nonlinearities and distortion components are
removed from the transfer function estimate. Thus, the ability to
use a periodic random signal eliminates leakage problems and
ensemble averaging is now useful for removing distortion because the
structure is subjected to a different excitation before each
measurement.
The only drawback to this approach is that it is not as fast as
pseudo random or pure random, since the transient part of the
structure's response must be allowed to die out before a new
ensemble average can be made. The time required to obtain a
comparable number of averages may be anywhere from 2 to 3 times as
long. Still, in many practical cases where a baseband measurement is
appropriate, periodic random provides the best solution, in spite of
the increased measurement time.
Sinusoldal Testing
Until the advent of the Fourier analyzer, the measurement of
transfer functions was accomplished almost exclusively through the
use of sweptsine testing. With this method, a controlled
sinusoidal force is input to the structure, and the ratio of output
response to the input force versus frequency is plotted. Although
sine testing was necessitated by analog instrumentation, it is
certainly not limited to the analog domain. Sinusoidally measured
transfer functions can be digitized and processed with the Fourier
analyzer or can be measured directly, as we will explain here.
In general, swept sinusoidal excitation with analog
instrumentation has several disadvantages which severely limit its
effectiveness:
1) Using analog techniques, the low frequency range is often
limited to several Hertz.
2) The data acquisition time can be
long.
3) The dynamic range of the analog instrumentation limits
the dynamic range of the transfer function measurements.
4)
Accuracy is often difficult to maintain.
5) Nonlinearities
and distortion are not easily coped with.
However, sweptsine testing does offer some advantages over
other testing forms:
1) Large amounts of energy can be input to the structure at each
particular frequency.
2) The excitation force can be controlled
accurately.
Being able to excite a structure with large amounts of energy
provides at least two benefits. First, it results in relatively high
signaltonoise ratios which aid in determining transfer
function accuracy and, secondly, it allows the study of structural
nonlinearities at any specific frequency, provided the sweep
frequency can be manually controlled.
Sine testing can become very slow, depending upon the frequency
range of interest and the sweep rate required to adequately define
modal resonances. Averaging is accomplished in the time domain and
is a function of the sweep rate.
A sinusoidal stimulus can be utilized in conjunction with a
digital Fourier Analyzer in many different ways. However, the
fastest and most popular method utilizes a type of signal referred
to as a "chirp." A chirp is a logarithmically swept sinewave that is
periodic in the analyzer's measurement window, T. The swept sine is
generated in the computer and output through the DAC every T
seconds. Figure l0G shows a chirp signal. The important advantage of
this type of signal is that it is sinusoidal and has a good
peaktorms ratio. This is an important consideration in
obtaining the maximum accuracy and dynamic range from the signal
conditioning electronics which comprise part of the test setup.
Since the signal is periodic, leakage is not a problem. However, the
chirp suffers the same disadvantage as a pseudo random stimulus;
that is, its inability to average out nonlinear effects and
distortion.
Any number of alternate schemes for using sinusoidal excitation
can be implemented on a Fourier analyzer. However, they will not be
discussed here because they offer few, if any, advantages over the
chirp and, in fact, generally serve to make the measurement process
more tedious and lengthy.
Transient Testing
As mentioned earlier, the transfer function of a system can be
determined using virtually any physically realizable input, the only
criteria being that some input signal energy exists at all
frequencies of interest. However, before the advent of
minicomputerbased Fourier analyzers, it was not practical
to determine the Fourier transform of experimentally generated input
and response signals unless they were purely sinusoidal.
These digital analyzers, by virtue of the fast Fourier transform,
have allowed transient testing techniques to become widely used.
There are two basic types of transient tests: (1) Impact, and (2)
Step Relaxation.
Impact Testing
A very fast method of performing transient tests is to use a
handheld hammer with a load cell mounted to it to impact the
structure. The load cell measures the input force and an
accelerometer mounted on the structure measures the response. The
process of measuring a set of transfer functions by mounting a
stationary response transducer (accelerometer) and moving the input
force around is equivalent to attaching a mechanical exciter to the
struck ture and moving the response transducer from point to point.
In the former case, we are measuring a row of the transfer matrix
whereas in the latter we are measuring a column.2
In general, impact testing enjoys several important advantages:
1) No elaborate fixturing is required to hold the structure under
test.
2) No electromechanical exciters are required.
3)
The method is extremely fast-often as much as 100 times as fast as
an analog sweptsine test.
However, this method also has drawbacks. The most serious is that
the power spectrum of the input force is not as easily controlled as
it is when a mechanical shaker is used. This causes
nonlinearities to be excited and can result in some variablity
between successive measurements. This is a direct consequence of the
shape and amplitude of the input force signal.
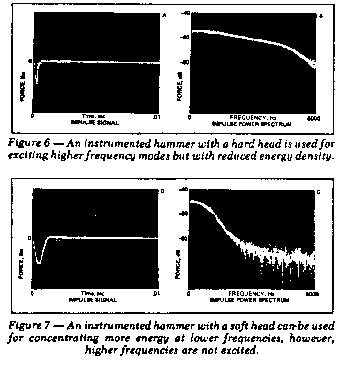
The impact force can be altered by using a softer or harder
hammer head. This, in turn, alters the corresponding power spectrum.
In general, the wider the width of the force impulse, the lower the
frequency range of excitation. Therefore, impulse testing is a
matter of tradeoffs. A hammer with a hard head can be used to
excite higher frequency modes, whereas a softer head can be used to
concentrate more energy at lower frequencies. These two cases are
illustrated in Figures 6 and 7.
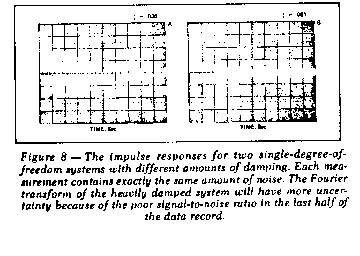
Since the total energy supplied by an impulse is distributed over
a broad frequency range, the actual excitation
energy density is often quite small. This presents a problem when
testing heavily damped structures, because the transfer function
estimate will suffer due to the poor signaltonoise ratio
of the measurement. Ensemble averaging, which can be used with this
method, will greatly help the problem of poor
signaltonoise ratios.
Another major problem is that of frequency resolution. Adequate
frequency resolution is an absolute necessity in making good
structural transfer function measurements. The fundamental nature of
a transient response signal places a practical limitation on the
resolution obtainable. In order to obtain good frequency resolution
for quantifying very lightly damped resonances, a large number of
digital data points must be used to represent the signal. This is
another way of saying that the Fourier transform size must be large,
since

Thus, as the response signal decays to zero, its
signalto-ratio becomes smaller and smaller. If it has decayed
to a small value before a data record is completely filled, the
Fourier transform will be operating mostly on noise, therefore
causing uncertainties in the transfer function measurement.
Obviously, the problem becomes more acute as higher frequency
resolutions are needed and as more heavily damped structures are
tested. Figure 8 illustrates this case for a simple
singledegreeoffreedom system. In essence, frequency
resolution and damping form the practical limitations for impulse
testing with baseband (dc to Fmax) Fourier analysis.
Since a transient signal may or may not decay to zero within the
measurement window, windowing can be a serious problem in many
cases, especially when the damping is light and the structure tends
to vibrate for a long fume. In these instances, the standard
rectangular window is unsatisfactory because of the severe leakage.
Digital Fourier analyzers allow the user to employ a variety of
different windows which will alleviate the problem. Typically, a
Hanning window would be unsuitable because it destroys data at the
first of the record-the most important part of a transient signal.
The exponential window can be used to preserve the important
information in the waveform while at the same time forcing the
signal to become periodic. It must, however, be applied with care,
especially when modes are closely spaced, for exponential smoothing
can smear modes together so that they are no longer discernible as
separate modes. Reference 4 explains this in more detail.
In spite of these problems, the value of impact testing for modal
analysis cannot be overstressed.
It provides a quick means for troubleshooting vibration problems.
For a great many structures an impact can suitably excite the
structure such that excellent transfer function measurements can be
made. The secret of its success rest with the user and his
understanding of the physics of the situation and the basics of
digital signal processing.
Step Relaxation Testing
Step relaxation is another form of transient testing which
utilizes the same type of signal processing techniques as the impact
test. In this method, an inextensible, lightweight cable is attached
to the structure and used to pre.load the structure to some
acceptable force level. The structure "relaxes" with a force step
when the cable is severed, and the transient response of the
structure, as well as the transient force input, are recorded.
Although this type of excitation is not nearly as convenient to
use as the impulse method, it is capable of putting a great deal
more energy into the structure in the low frequency range. It is
also adaptable to structures which are too fragile or too heavy to
be tested with the handheld hammer described earlier.
Obviously, step relaxation testing will also require a more
complicated test setup than the impulse method but the actual data
acquisition time is the same.
Testing a Simple Mechanical System
A singledegreeoffreedom system was tested with
each type of excitation method previously discussed. Besides
measuring the linear characteristics of the system with each
excitation type, gross nonlinearity was simulated by clipping
approximately onethird of the output signal. This condition
simulates a "hard stop" in an otherwise unconstrained system. The
intent ot these tests was to show how certain forms of excitation
can be used to measure the linear characteristics of a system with a
large amount of distortion. This is extremely important to the
engineer who is interested in identifying modal parameters.
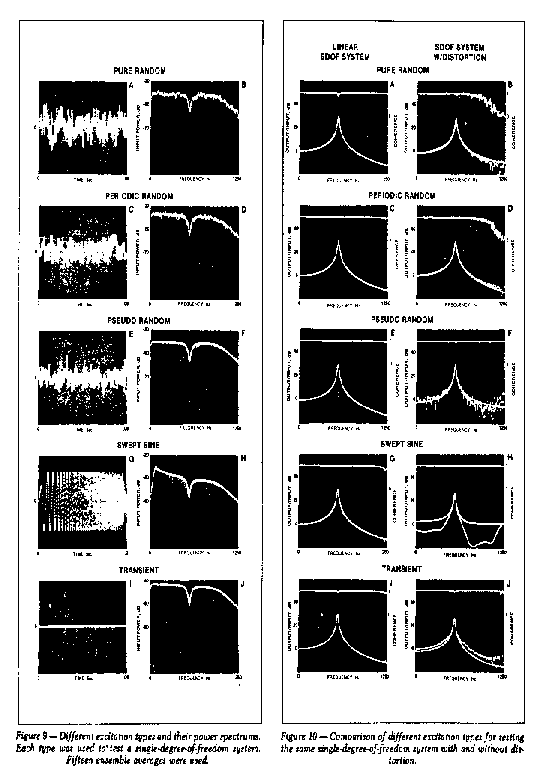
Figure 9 illustrates the form of each type of stimulus and its
power spectrum after fifteen ensemble averages. Notice that the
input power spectrums for both the pure random and periodic random
cases have more variance than the others. This is because each
ensemble average consisted of a new and uncorrelated signal for
these two stimuli. The pseudo random and swept sine (chirp) signals
were controlled by the analyzer's digitaltoanalog
converter and each ensemble average was in fact the same signal,
thus resulting in zero variance. In this test, the transient signal
was also controlled by the DAC to obtain recordtorecord
repeatability and resulting zero variance. In all cases, the
notching in the power spectrums is due to the impedance mismatch
between the structure and the shaker. A final interesting note is
that all spectrums except the swept sine are flat out to the
cutoff frequency. The rolloff of the swept sine spectrum
is due to the logarithmic sweep rate. Thus, the spectrum has reduced
energy density as the frequency is increased.
Recall that in Part I we discussed the use of the coherence
function to assess the quality of the transfer function measurement.
In Figure 10, the results obtained from testing the
singledegreeoffreedom system with and without
distortion are shown. In Figures 10A and 10B, the cases for pure
random excitation, notice that the coherence is noticeably different
from unity in the vicinity of the resonance. This is due to the
nonperiodicity of the signals and the
fact that Hanning windowing was used to reduce what would have
otherwise been even more severe leakage. The leakage effect is much
more sensitive here, due to the sharpness of the resonance, i.e.,
the rate of change of the function. Although the effect is certainly
present throughout the rest of the band, the relatively small
changes in response level between data points away from the
resonance will obviously tend to minimize the leakage from adjacent
channels. Although any number of different windowing functions could
have been used, the phenomenon would still exist.
Figures 10C10J show the results of testing the system with
the other excitation forms. In all figures showing the distorted
case, the best fit of a linear model to the measured data is also
shown. The coherence is almost exactly unity for the linear cases
shown in Figures l0C. E, G and I. This is because all are ideally
leakagefree measurements because they are periodic in the
analyzer's measurement window. For the cases with distortion, the
latter three show very good coherence even though the system output
was highly distorted. This apparently good value of coherence is due
to the nature of the zero-variance periodic signals used as stimuli.
In cases l0B and l0D, the measurements are truly random from average
to average and the coherence is more indicative of the quality of
the measurement. The low coherence values at the higher frequencies
are primarily a result of the poor signal energy available. The
conclusion is that the coherence function can be misleading if one
does not understand the measurement situation.
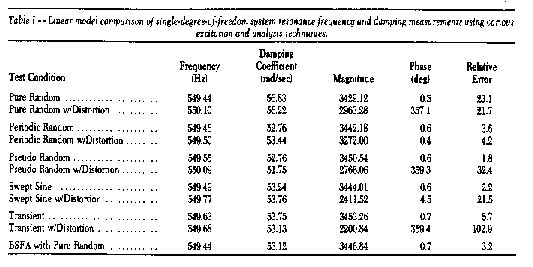
Even though the system was highly distorted, it is apparent that
the pure random and periodic random stimuli provided the best means
for transfer function measurements, as seen in Figures l0B and l0D.
Again, this is due to their ability to effectively use ensemble
averaging to remove the distortion components from the measurement.
The distortion cannot be removed using the other types of periodic
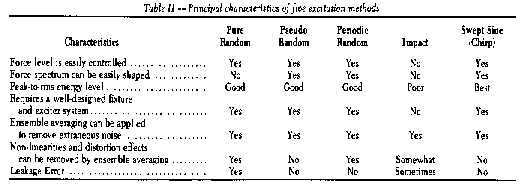
stimuli and this is evident in Figures l0F, H and J. The results
obtained from fitting a liner model to the measured data are given
in Table I.
In all cases where the linear motion was measured, each type of
excitation gave excellent results, as indeed they should. The one
item worthy of mention is the estimate of damping with the pure
random result. In this case, the value is about 7% higher than the
correct value. This error is due to the windowing effect on the
data. In this test, a Hanning window was used. However, any number
of other windows could have been used and error would still be
present. Further evidence of the Hanning effect on the data is shown
by the error between the linear model and the measured data.
Of considerable importance is the data for the simulated
distortion. The primary conclusion that can be drawn from these data
is that the periodic random stimulus provides a good means for
measuring the linear response of a linear system and is clearly
superior to a pure random stimulus. It is also the best possible
excitation for measuring the linear response of a system with
distortion. Evidence of this is seen in the quality of the parameter
estimates in Table I and the relative error (the error index between
the ideal linear model and the measured data). The principal
characteristics of each type of excitation are summarized in Table
II.
Increasing Frequency Resolution
Certainly the single most important factor affecting the accuracy
of modal parameters is the accuracy of the transfer function
measurements. And, in general, frequency resolution is the most
important parameter in the measurement process. In other words, it
is simply not possible to extract the correct values of the modal
parameters when there is inadequate information available to
process. Modern curve fitting algorithms are highly dependent on
adequate resolution in order to give correct parameter estimates,
including mode shapes.
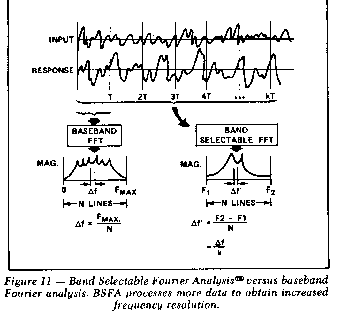
In this section we will introduce Band Selectable Fourier
Analysis (BSFA), the socalled "zoom" transfonn. BSFA is a
measurement technique in which the Fourier transform is performed
over a frequency band whose lower and upper limits are independently
selectable. This is in contrast to standard baseband Fourier
analysis, which is always computed over a frequency range from zero
frequency to some maximum frequency, Fmax. From a
practical viewpoint, in many complex structures, modal density is so
great, and modal coupling (or overlap) so strong, that increased
frequency resolution over that obtainable with baseband techniques
is an absolute necessity for achieving reliable results.
In the past, many digital Fourier Analyzers have been limited to
baseband spectral analysis; that is, the frequency band under
analysis always extends from dc to some maximum frequency. With the
Fourier transform, the available number of discrete frequency lines
(typically 1024 or 512) are equally spaced over the analysis band.
This, in turn, causes the available frequency resolution to be,  , where N is the Fourier transform
block size, i.e., the number of samples describing the realtime
function. There are N/2 complex (magnitude and phase) samples in the
frequency domain. Thus, Fmax and the block size, N,
determine the maximum obtainable frequency resolution.
The problem with baseband Fourier analysis is that, to increase
the frequency resolution for a given value of Fmax the
number of lines in the spectrum (i.e., the block size) must
increase. There are two important reasons why this is an inefficient
way to increase the frequency resolution:
1) As the block size increases, the processing time required to
perform the Fourier transform increases.
2) Because of available
computer memory sizes, the block size is limited to a relatively
small number of samples(typically a maximum of 4096).
More recently, however, the implementation of BSFA has made it
possible to perform Fourier analysis over a frequency band whose
upper and lower frequency limits are independently selectable. BSFA
provides this increased frequency resolution without increasing the
number of spectral lines in the computer.
BSFA operates on incoming time domain data to the analyzer's
analogtodigital converter or time domain data that has
previously been recorded on a digital mass storage device. BSFA
digitally filters the time domain data and stores only the filtered
data in memory. The filtered data corresponds to the frequency band
of interest as specified by the user. The procedure is completed by
performing a complex Fourier transform on the filtered data.
Of fundamental importance is the fact that the laws of nature and
digital signal processing also apply to the BSFA situation. Since
the frequency resolution is always equal to the reciprocal of the
observation time of the measurement, delta f = 1/T, the digital
filters must process T seconds of data to obtain a frequency
resolution of 1/T in the analysis band. Whereas in baseband Fourier
analysis the maximum resolution is always  the resolution with BSFA is
  where BW is the independently
selectable bandwidth of the BSFA measurement. Therefore, by
restricting our attention to a narrow region of interest below
Fmax and concentrating the entire power of the Fourier
transform in this interval, an increase in frequency resolution
equal to Fmax/BW can be obtained (Figure 11).
The other significant advantage of BSFA is its ability to
increase the dynamic range of the measurement to 90 dB or more in
many cases. The increased dynamic range of BSFA is a direct result
of the extremely sharp rolloff and outof-band rejection of
the preprocessing digital filters and of the increased
frequency resolution which reduces the effect of the white
quantizing noise of the analyzer's analog-todigital
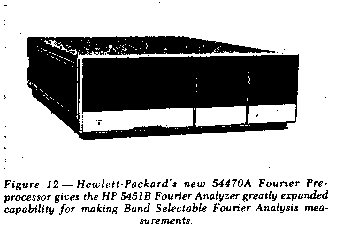
converter.5 Certain types of BSFA filters can provide
more than 90 dB of outofband rejection relative to a full
scale inband spectral line, a characteristic which is not
matched by more traditional analog range translators (see Figure
12).
The simple singledegreeoffreedom system which was
tested with the various excitation types was also tested with BSFA
using pure random excitation We saw that in the baseband case, pure
random was the least desirable signal because of the associated
leakage and the resulting distortion of the transfer function
waveform introduced by the Hanning window. By using BSFA, leakage is
no longer an important source of error because of the great increase
in the number of spectral lines used to describe the system. Figure
13 shows the coherence and transfer function between 524.6 Hz and
579.6 Hz with a resolution of 0.269 Hz, an increase of more than 18
over the baseband result. Note that the coherence is almost exactly
unity, indicating the
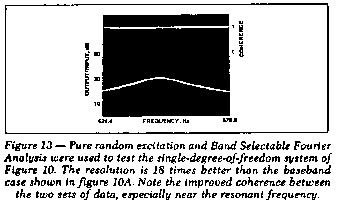
absence of any error due to leakage, and confirming the quality
of the BSFA measurement. As shown in Table I, the use of BSFA
eliminates the error caused by the leakage in the baseband
measurement.
A Practical Problem. To illustrate the importance of BSFA, a
mechanical structure was tested and modes in the area of 1225 Hz to
1525 Hz were to be investigated. Figure 14 is a typical baseband
(dcFmax) transfer function measurement. It was taken
with the following parameters:


Pure random noise was used to excite the structure through an
electrodynamic shaker.
The Inadequacy of the Baseband Measurement. Note that two modes
are clearly visible between 1225 Hz and 1525 Hz. This same
measurement is shown in rectangular or co/quad form in Figure 15.
Again, by examining the quadrature response, the two modes are seen,
However, there is also a slight inflection in the response between
these two modes which indicates that yet a third mode may be
present. But there is insufficient frequency resolution to
adequately define the mode.
Returning to Figure 15, a partial display of the region between
1225 and 1525 Hz was made. The expanded quadrature display is shown
in Figure 16. Realize that this represents no increase in frequency
resolution, only an expansion of the plot. Clearly, only two modes
were found.
Accurate Measurements with BSFA. In order to accurately define
the modes in this region, the structure was retested using Band
Selectable Fourier Analysis (BSFA). All 512 lines of spectral
resolution were placed in a band from 1225 to 1525 Hz, resulting in
a resolution of 0.610 Hz instead of 9.76 Hz, as in the baseband
measurement. The quadrature response attained with the BSFA is also
shown in Figure 16 for comparative purposes. Note that three modes
are now clearly visible. The small (third) mode of approximately
1350 Hz is now well defined, whereas it was not even apparent
before. In addition, the magnitude of the first mode at 1320 Hz is
seen to be at least three times greater in magnitude than the result
indicated by the baseband measurement. The corresponding results in
log form are shown in Figure 17. This BSFA result was obtained by
using only a 16:1 resolution enhancement. Enhancements of more than
100:1 are possible with BSFA.
Implications of Frequency Resolution in Determining Modal
Parameters and Mode Shapes. Referring again to Figure 15, we can
clearly see the necessity of using adequate frequency resolution for
making a particular measurement. In addition, it is important to
understand how the baseband result would lead to an incorrect answer
in terms of modal parameters and mode shape.
A) Modal Parameters. If the baseband result is compared to the
BSFA result for the 1320 Hz mode it is obvious that the baseband
result would indicate that the mode is much more highly damped than
it actually is. The second small mode (1350 Hz) would not even be
found, and the 1400 Hz mode would also have the wrong damping. Close
inspection also shows that the estimate of the resonance frequency
for the 1320 Hz mode would have significant error.
B) Mode Shape. Any technique for estimating the mode shape
coefficients (e.g., quadrature response, circle fitting,
differencing, least squares, etc.) would clearly be in error since
it is apparent that the BSFA result shows a quadrature response at
least three times greater than the baseband result.
Although the proceeding example presented a case where the use of
BSFA was a necessity, it is very easy for the engineer to be misled
into believing he has made a measurement of adequate resolution when
in fact he has not. The following concluding example illustrates
this point and presents the estimates of the modal parameters for
each case.
A disc brake rotor was tested using an electrodynamic shaker
and pure random noise as a stimulus. A load cell was used to measure
the input force and an accelerometer mounted near the driving point
was used to measure the response. The baseband measurement had a
resolution of 9.76 Hz. As can be seen in Figure 18A, the two major
modes at about 1360 Hz and 1500 Hz appear to be well defined. An
expanded display (no increased resolution) from 1275 Hz to 1625 Hz
clearly shows the two large modes and a much smaller mode at about
1580 Hz.
The rotor was retested using BSFA and the two sets of data
are compared in Figure 18. This data clearly shows the value of
BSFA. The BSFA data provides increased definition of the modal
resonances, as can be seen by comparing the baseband and BSFA
results. The validity of each result is reflected in the respective
coherence functions. The baseband transfer function contains
inaccuracies due to the Hanning effect, as well as inadequate
resolution. The coherence for the BSFA measurement is unity in the
vicinity of all three modal resonances, indicating the quality of
the transfer function measurement. Further proof of the increased
modal definition is shown in the BSFA Nyquist plot (co versus quad).
Here, all three modes are clearly discernible and form almost
perfect circles, indicating an excellent measurement, almost totally
free of distortion. In the baseband result, only three or four data
points were available in the vicinity of each resonance, whereas in
the BSFA data many more points are used.
The modal parameters for all three modes were identified from the
baseband and BSFA data and the results are shown in Table III.
Comparison of results emphasizes the need for BSFA when accurate
modal parameters are desired.
In summary, no parameter identification techniques are capable of
accurately identifying modal parameters or mode shapes when the
frequency resolution of the measurement is not adequate.
Summary
We have seen that frequency response functions can be used for
identifying the modes of vibration of an elastic structure and that
the accurate measurement of the frequency response functions is the
most important factor affecting the estimates of the modal
parameters.
Pure random, pseudo random, periodic random, swept

sine, and transient techniques for baseband Fourier analysis were
discussed. All types of stimuli, except for pure random, gave
excellent results when used for testing a linear system. The pure
random result contained some error because its nonperiodicity
in the measurement window required that Hanning be used on the input
and response waveforms, resulting in some distortion of the transfer
function.
For systems with distortion, periodic random offers significant
advantages over the other types of stimuli. It is best able to
measure the linear response of distorted systems. This means that
modal parameters extracted from transfer functions measured with
periodic random will be more accurate. None of the techniques
discussed are capable

of compensating for inadequate frequency resolution. Band
Selectable Fourier Analysis was introduced as a means for
arbitrarily increasing the frequency resolution of the frequency
response measurement by more than 100 times over standard baseband
measurements. BSFA's increased resolution provides the best possible
means for making measurements for the identification of modal
parameters and, in a great number of practical problems, is the only
feasible approach.
References
1. Fourier Analyzer Training Manual, Application Note 140-0,
Hewlett-Packard Company.
2. Ramsey, K. A., "Effective Measurments
for Structural Dynamics Testing Part I, Sound and Vibration,
November 1975."
3. Roth, Peter, "Effective Measurements Using
Digital Signal Analysis," IEEE Spectrum, pp. 62-70, April 1971
4.
Richardson, M., "Modal Analysis Using Digital Test Systems," Seminar
on Understanding digital control and Analysis is Vibration Test
Systems, Shock and Vibration Information Center publication, May
1975.
5. McKinney, W., "Band Selectable fourier Analysis,"
Hewlett-Packard Journal, April 1975, pp 20-24.
6. Potter, R. and
Richardson, M., "Mass, Stiffness and Damping Matrices from Measured
Modal Parameters," ISA Conference and Exhibit, New York City,
October 1974.
7. Potter,R., "A General Theory of Modal Analysis
for Linear Systems," Shock and Vibration Digest, November 1975.