TIMOTHY A. MOUCH
STRUCTURAL MEASUREMENT SYSTEMS
STEVE AKERS
FORD MOTOR COMPANY
ADVANCED VEHICLE
ENGINEERING TECHNOLOGY
JOHN HICKS
FORD MOTOR COMPANY
ADVANCED VEHICLE ENGINEERING TECHNOLOGY
ABSTRACT
This paper will discuss the effects of digital
signal processing errors caused by improper analog to digital
conversion settings. Four signal types will be analyzed: overload
and underload on the input channel; and, overload and underload on
the response channel. The errors will be shown to affect the quality
and accuracy of the measured frequency response function. The errors
which are present in the measurement will also be shown to exist as
an inaccurate estimate of the modal residue obtained through
curvefitting.
INTRODUCTION
Through advances in the field of dynamic analysis,
structural analysts are able to predict the dynamic response of a
structure through an experimental modal test. This gives the analyst
a very powerful tool for structural modifications, providing the
results of the modal test are an accurate representation of the
dynamics of the structure.
The modal test can be divided into two
parts:
1) Modal Data Acquisition, and
2) Modal Parameter Estimation
The first step of the modal data acquisition
process requires analog voltages representing structural response to
be converted to digital signals to conform to the requirements of
digital computers. This conversion is one of the first places errors
in modal data can occur. These errors will then be carried through
the entire test and can distort the results of the test.
However, the modal practitioner can minimize the
effects of the error once an error has been recognized. It is the
intent of this paper to characterize four ADC errors and show the
effect of the errors on the modal parameter estimation of the
residue term. This will then enable the modal practitioner to
recognize these ADC errors and the seriousness of each error on the
estimate of the residue term.
In order to speak of recognizing erroneous
measurements or sets of measurements, one must first define an
accurate measurement to be used for comparison. Figure 1 represents
an accurate dynamic description of an engine/powertrain assembly
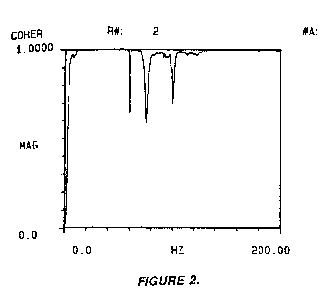
driving point function. Figure 2 represents the coherence function
for the measurement in Figure 1.
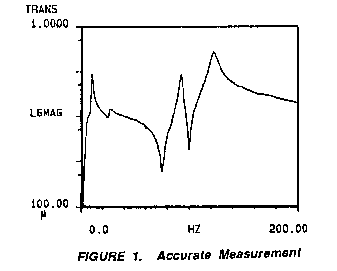
The
structure was excited with burst random noise. The amplitude of the
excitation was optimized to a 1 volt ADC setting on the Fourier
analyzer. The optimization entailed increasing the amplitude of the
signal until an ADC overflow occurred and then reducing the
amplitude just enough to avoid the overflow
completely.
A similar type optimization was performed on the
response channel, except only by adjusting the gain of the power
amplifier.
The first set of errors to be discussed will be ADC
overloading. ADC overloading can be defined as providing a signal to
the ADC greater than the available dynamic range of the current ADC
setting. Typically, an analyzer will have up to 80 dB of dynamic
range. An overload will occur if the dynamic range of the power
spectrum signal is greater than 80 dB. ADC overloads can occur on
either input or response channels.
An ADC
overload on the input can be caused by the range of the ADC set to
.1 volts while maintaining a 1 volt input signal. The frequency
response function (frf) and coherence function are shown in Figures
3 and 4, respectively. Overlayed on each function is the measurement
and coherence of the accurate measurement.
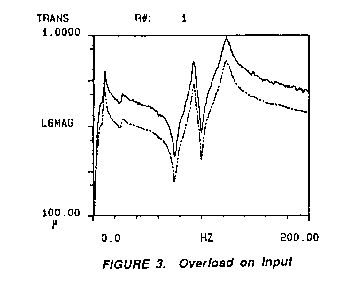
A comparison
of the two frf's show substantial amplitude differences between the
two functions. This bias error represents the "clipping" of the
input signal. The amount of "clip" is equivalent to the maximum
level of the ADC. In this case, the maximum level is .1 volts. This
example has a 1 volt signal being represented as a .1 volt signal.
With the frf being a ratio of the output to input, the analyst is
effectively reducing the input spectrum, thus reducing the value of
the denominator term of the function. This will account for the
amplification of the function as seen as the bias error in Figure
3.
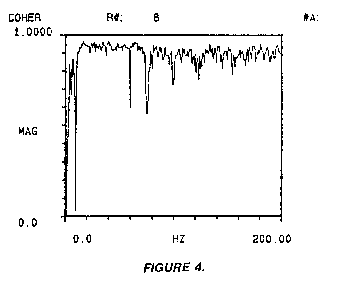
Figure 3 also shows appreciable noise imbedded in
the function. This "rattiness" is caused by the Fourier transform of
the "clipped" signal. This signal will cause jump discontinuities in
the signal which will cause errors when the time domain signal is
transformed to the frequency domain via the Fourier
transform.
A similar overload condition can occur on the
response channel. The response signal is maintained at 1 volt and
the ADC setting is erroneously set at .1 volt. Figure 5 represents
the frf measured in this condition. The amplitude of the frf is
biased lower than the accurate measurement. This error is a function
again of the clipped signal's effect on the calculation of the
frequency response function. The "clipped" signal erroneously
reduces the amplitude of the response signal which comprises the
numerator term of the frf. This forces the ratio of the two signals
to be lower than an accurate measurement.
The frf of Figure 5 shows substantial noise off
resonance. The noise in the function is due to the truncated signal
of the response channel. Similar to an input overload, the
truncation of the signal force jump discontinuities in the time
domain which will show up as errors in the frequency
domain.
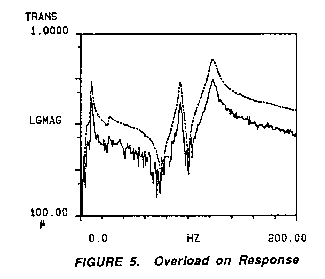
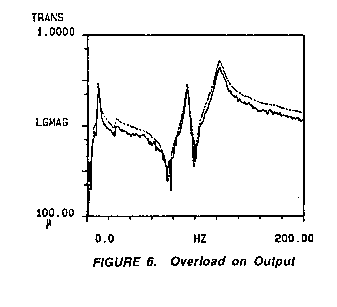
Figure 6
represents another overload on the response channel, only this time
the 1 volt response signal is truncated by a .25 volt ADC setting.
In comparison to Figure 5, the severity of the error can be directly
correlated to the mismatch between signal strength and the ADC
setting. Figure 6 shows similar characteristics to the measurement
shown in Figure 5 only to a lesser degree of error from the known
accurate measurement.
The
second error associated with ADC settings is an underload. In an
underload condition, the desired signal does not fill the entire
range of the ADC's available dynamic range. The desired signal may
actually reside in the noise making it undistinguishable from the
noise. The severity of this condition is again dependent on the
mismatch between signal strength and the ADC setting.
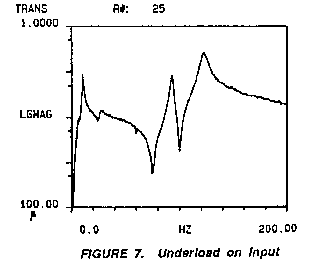
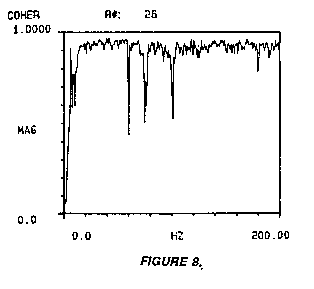
An underload condition on the input spectrum is
represented in Figures 7 and 8. The measurement represents a
mismatch between the signal and ADC setting by a factor of 500. The
frf represented in Figure 7 is very similar to the overlayed
accurate frf with the exception of the noise off resonance. However,
the coherence function of Figure 8 show a degradation of the
measurement throughout the spectrum. This degradation and noisiness
of the frf describe the signal being lost in the noise floor of the
input spectrum. The time domain representation of the signal will
show digitized low level noise as the input. The ratio of the input
to output signals does not show direct causality as evidenced in the
coherence function.
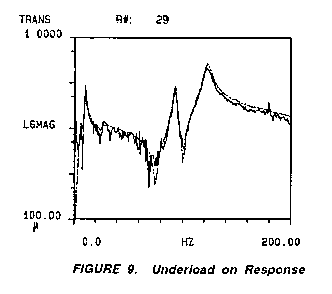
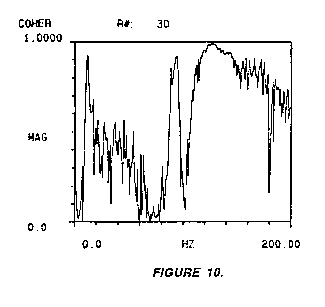
The final
error to be discussed is an underload condition on the response
channel. Figures 9 and 10 will show the frf and coherence function
of this condition, respectively. The measured frf was acquired with
the mismatch between the actual signal and the ADC setting being a
factor of 400. Analysis of the data shows a noisy frf with poor
coherence. The response signal is in the noise and the frf ratios
the noise as a numerator term which produces noise off resonance and
low coherence due to the effects of the measured response (noise)
not being caused by the input signal.
The effects
of ADC errors have been seen and discussed with respect to frequency
response functions. However, it is important also to realize the
effects of the errors on the estimates of the modal parameters. The
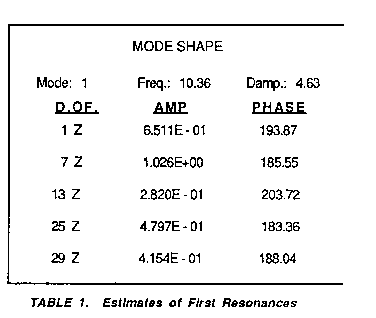
measured frequency response functions contain three resonances.
These resonances occur at 10.36 Hz, 92.99 Hz and 122.50 Hz. A single
degree of freedom polynomial was used to estimate the modal
parameters for each resonance. Table 1 shows the estimates for the
first resonance. DOF 1 Z corresponds to an accurate measurement with
the estimate of the residue amplitude = .6511 G/lbsec. DOF 7 Z
represents the estimate for an overload on the input. The residue
amplitude estimate is 1.026 G/lbsec. This represents a 57%
amplitude error. DOF 13 Z represents the overload on the response
condition and is in error by 57%. DOF 25 Z represents the estimate
for the underload on the input condition. The amplitude estimate is
in error by 26%. The underload on the response condition corresponds
to DOF 29 Z and is in error by 36%.
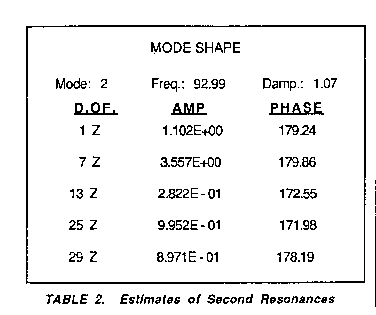
Similar
type curvefits were run on the second and third resonance. These
results are seen in Tables 2 and 3, respectively.

CONCLUSION
The ADC settings can
have a very large effect on the quality of a measurement. These
errors are not always easily detected if only the frequency response
function is examined. The purpose of this paper is to reemphasize
the importance of optimizing the ADC and amplifier settings for the
best signal to noise ratios. The errors caused by ADC mismatch to
signal strength are carried through to the parameter estimation
process and can be seen in the estimates of the amplitude of the
residue term. The amount of error present is directly proportional
to the degree of mismatch between the ADC setting and signal
strength. The overload errors have a more detrimental effect on the
measurement than the underload conditions. By recognizing each of
these error types, the analyst can better arm himself to make
accurate measurements.
REFERENCES
1. Oppenheim, A. and R. Schafer, "Digital Signal
Processing", Prentice Hall, Englewood Cliffs, NJ, 585 pp.
2. Allemang, Zimmerman, Brown, "Techniques for
Reducing Noise in Frequency Response Measurements", ASME Winter
Annual Meeting, 12/16/79.
3. Wada, B.K., "Modal Test Measurement and
Analysis Requirements".
4. Ramsey, K., "Effective Measurements for
Structural Dynamic Testing", Sound and Vibration, Nov. 1975.
5. Ramsey, K., "Effective Measurements for
Structural Dynamic Testing, Part 2", Sound and Vibration, April
1976.